The beginnings of Lincoln Avenue in Walnut Hills came officially in 1877, when the tree names for streets in the newly absorbed hilltop suburb caused sufficient confusion with the tree names for streets in the Cincinnati basin to warrant something new. The blocks, as we saw in the previous post, already existed; they were lined with dwellings and they were peopled. To put things in historical context, the Civil War had ended a dozen years earlier in 1865, the same year as Abraham Lincoln’s assassination. After the disastrous administration of Lincoln’s vice president Andrew Johnson, Ulysses Grant had been elected in 1872 and reelected in 1876. The memorializing of the fallen hero with Lincoln Avenue came near the height of Reconstruction, and the short-lived rise of African American political power in the South. A post-war boom in Cincinnati saw tremendous growth in Walnut Hills.
 By looking at census data from 1870 and 1880, we learn that Lincoln Avenue in Walnut Hills has always been mostly Black. Moreover, and more striking, the Black and white populations were in most ways quite comparable. Census counts and statistics are notoriously complicated and require some technical explanation which I will leave to the section Dealing with the data: census statistics from 1870 and 1880 below. With reasonable confidence I can say that in 1870 about 206 people lived on or very near what would become Lincoln Avenue, and that about 121 (59%) of them were Black – either recorded as such, or as “Mulatto”, by the census taker. African Americans accounted for about 29 of 48 families as assigned by the census taker. They occupied 39 of 64 dwellings in our sample. While the Black families had noticeably more variation in size, and more often doubled up in single dwellings, the statistics show a black majority of 55% to 60% by any of these three measures.
In 1880, where each dwelling was unambiguously located on a street, Lincoln Avenue (still listed in the Census as Sycamore and Walnut) had about 292 residents. The growth may owe as much to the ease of identifying the buildings on the street. A different guess (not quite a hypothesis) about the 1870 data could put the sample as high as 300, with slightly higher increases in the Black counts than in the white. Yet the percentages wouldn’t change much. The similarity between the 1870 and 1880 statistics, no matter how we handle the earlier numbers, is striking. The number of Blacks rose slightly to 214 (73%), with a falling off white residents to 78. Black households constituted 58 of 76 listed in 1880, they occupied 43 of the 61 dwellings in the 1880 enumeration. All three these statistics range from about 60% to 75%.
The Black population along Lincoln Avenue had many similarities with the whites in the samples as well. In 1870, about half of the dwellings included an individual owning real estate, and the percentage of Black and white dwellings were very close. White property holdings averaging $1379 were a little higher than the $1133 average for Blacks. Both races exhibited considerable variation in property wealth; the values in fact overlapped considerably. Both Black and white owners had properties ranging in value from about $500 to $3000. We cannot determine whether all that real estate was owner-occupied homes or whether it represented multiple properties like businesses (at the time more commonly owned by whites), so stronger conclusions are not possible. It is striking – we acknowledge our prejudices by saying surprising – that five years after then end of the Civil War the Black folk on Lincoln Avenue on average had nearly as much property wealth as the whites. Yet personal wealth – essentially cash on hand – showed a much larger disparity across the color line; even among those who had such a personal estate. Black households with savings averaged about $75 while whites claimed something like $250. The failure of the Freedmen’s Bank in 1874 would rob many Black veterans of their personal assets, but that is a question for another project. The 1880 census no longer asked about real or personal estate.
Literacy in 1870 (again a question lacking in the 1880 census) showed a starker contrast between the races, but much smaller than national averages of about 90% literacy among whites and 15% among Blacks. In our Lincoln Avenue sample 88% of whites were able to write and an additional 4% could read. For Blacks, just five years after the end of the Civil War, fully two-thirds of those twelve and older were able to read, and half could both read and write! Limiting the age range to 12-30, black readership rose to 80%. We can only speculate about how many Blacks became literate as free people before the War, how many had learned to read while enslaved, and how many had been taught to read in Freedmen’s camps or in Cincinnati after the War.
The Black population of Lincoln Avenue set a pattern that would persist in Walnut Hills for more than a century. They were wealthier and better educated than their Black peers elsewhere in the city, and comparable demographically to their white neighbors. Blacks also compared favorably with whites in terms of schooling. Forty-four of fifty-six (79%) Black children aged six to eighteen attended school, while in the comparable white population sample the figure was only 60% – twenty-seven of forty-five. If we compare data for the whole of Walnut Hills, the difference is smaller, 74% to 71%, but Blacks still outpaced whites. The 1880 census did not include a simple checkbox for school attendance. Children’s “occupations” were however listed. Twenty-one of thirty Blacks (70%) between 6 and 26 years old were counted “At School”, essentially the same as 9 of 13 Whites (69%). Five Blacks (17%) had an adult occupation listed, compared with only 1 of 13 whites (8%). The rest of the children were listed “At Home” – a category mostly applied to young white adults apparently finished with school but not yet launched into the world of work or marriage. For literacy and schooling, as for property and personal wealth, the take-home message is that on what would become Lincoln Avenue, Black and white populations were quite comparable, and substantial.
Dealing with the data: census statistics from 1870 and 1880
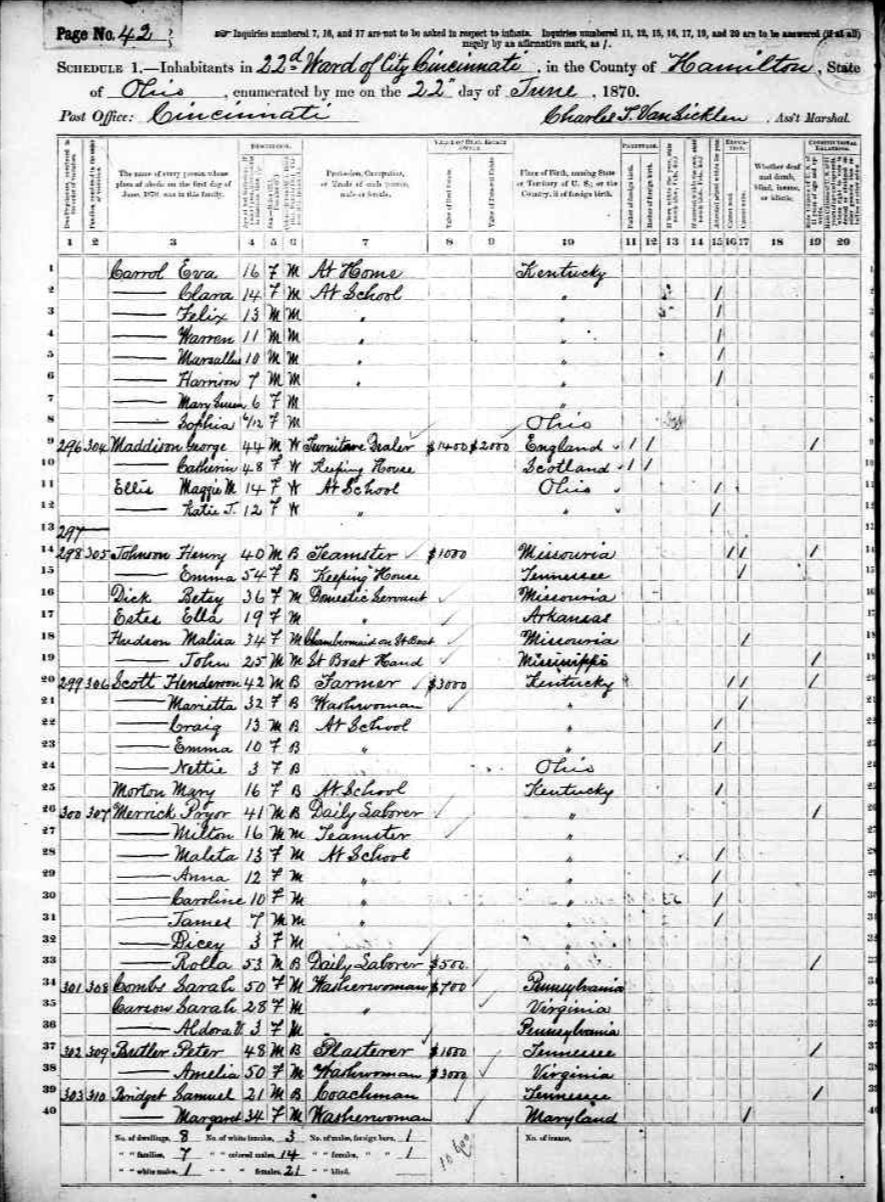
The decennial census required by the constitution generated vast qualities of handwritten paper forms. It is a miraculous monument to bureaucracy that that almost all of them have survived. (The results from 1890 were lost to a storage facility fire.) For the purposes of the constitution, counting people occurred quickly. Then armies of clerks sifted slogged through papers, bound into books, and compiled the numbers for the Science of the State, or Statistics – according to Mark Twain the most egregious of the three kinds of lies: “lies, damned lies, and statistics.” Otherwise the huge volumes of raw data contained the names attached to the more valued numbers about occupations, literacy, property, and family relations ignored by the statisticians. Yet people want that “merely personal” information in order to study genealogy, so the information was disseminated on microfilm, and the microfilms have made their way to the internet, and the genealogically interesting data has been transcribed more or less faithfully by volunteers.
Within a given volume – for Walnut Hills, the twenty-second ward in 1870 or enumeration district 113 in 1880, there is a great deal of chaos. The 1870 census contains no specific location information; in 1880 we find the street name for each household, and incompletely gathered street numbers which were just coming into fashion. So we are able in 1880 to work with confidence on the details of what would become Lincoln Avenue – street names still listed by the old names of Sycamore and Walnut. In 1870 it is much harder. We must make the assumption that the census taker walked along the roads in some straightforward way, and then reason backwards from other information about who lived where to guess – to make a reasonable hypotheses – about which pages of census data represent which streets. A marginal note (presumably reminding the worker where he had left off one day) says “Sycamore between Elm and Maple” – with today’s street names, Lincoln between Alms and Park. Matches on names between the 1870 and 1880 census books, along with known addresses of a few residents, place the next hundred residents on Sycamore, another grouping a bit later seem to match with people in the next census on Walnut. The series of about 300 people on consecutive pages in the census also include a couple of smaller groupings who seem to have been on Chestnut (now Foraker) just north of Sycamore (Lincoln). A smaller contiguous list or just over 200 individuals, excluding all those probably on Chestnut, yields very similar percentages of Blacks, literacy rates, and property. For simplicity’s sake I have used the grouping of 200 knowing there are a few missing entries from Sycamore. For a clear reference, my smaller sample includes families labeled by the census taker numbers 299-345; the larger sample, including some dwellings on Chestnut, includes familes 299-370.
Complete statistics for the more restrictive data set show slightly lower percentages of Black individuals, families, and dwellings:
Small Sample for Lincoln Avenue
| Race2 | Individuals | percent | Families | percent | Dwellings | percent |
| Black | 121 | 59% | 29 | 60% | 23 | 55% |
| White | 85 | 41% | 19 | 40% | 19 | 45% |
| Total | 206 | 48 | 42 |
Large Sample for Lincoln Avenue
| Race | Individuals | percent | Families | percent | Dwellings | percent |
| Black | 189 | 63% | 48 | 67% | 39 | 61% |
| White | 112 | 37% | 24 | 33% | 25 | 39% |
| Total | 301 | 72 | 64 |
Literacy rates, Small sample
| Total | Read | percent | Write | percent | |
| Black | 77 | 51 | 66% | 40 | 52% |
| White | 50 | 46 | 92% | 44 | 88% |
Literacy rates, large sample
| Total | Read | percent | Write | percent | |
| Black | 126 | 84 | 67% | 60 | 48% |
| White | 70 | 64 | 91% | 61 | 87% |
School Attendance, small sample
| Total | Attended | percent | |
| Black | 38 | 33 | 87% |
| White | 35 | 21 | 60% |
School attendance, large sample
| Total | Attended | percent | |
| Black | 56 | 44 | 79% |
| White | 45 | 27 | 60% |
1880 Population, Household and Dwelling Statistics by Race
| Individuals | percent | Families | percent | Dwellings | percent | |
| Black | 214 | 73% | 58 | 75% | 43 | 70% |
| White | 78 | 27% | 19 | 25% | 18 | 30% |
| Total | 292 | 77 | 61 |
Employment of Children 6-16, 1880
| Total | At School | At Home | Working | |
| Black | 30 | 21 | 4 | 5 |
| percent | 70% | 13% | 17% | |
| White | 13 | 9 | 3 | 1 |
| 69% | 23% | 8% |
Geoff Sutton